We often take it for granted that animals can be smart. Corvids have distinct cultures, can cheat death, and will hold a grudge. Elephants refer to each other by name. Dogs will throw children into rivers to score a tasty snack. You know – normal signs of intelligence.
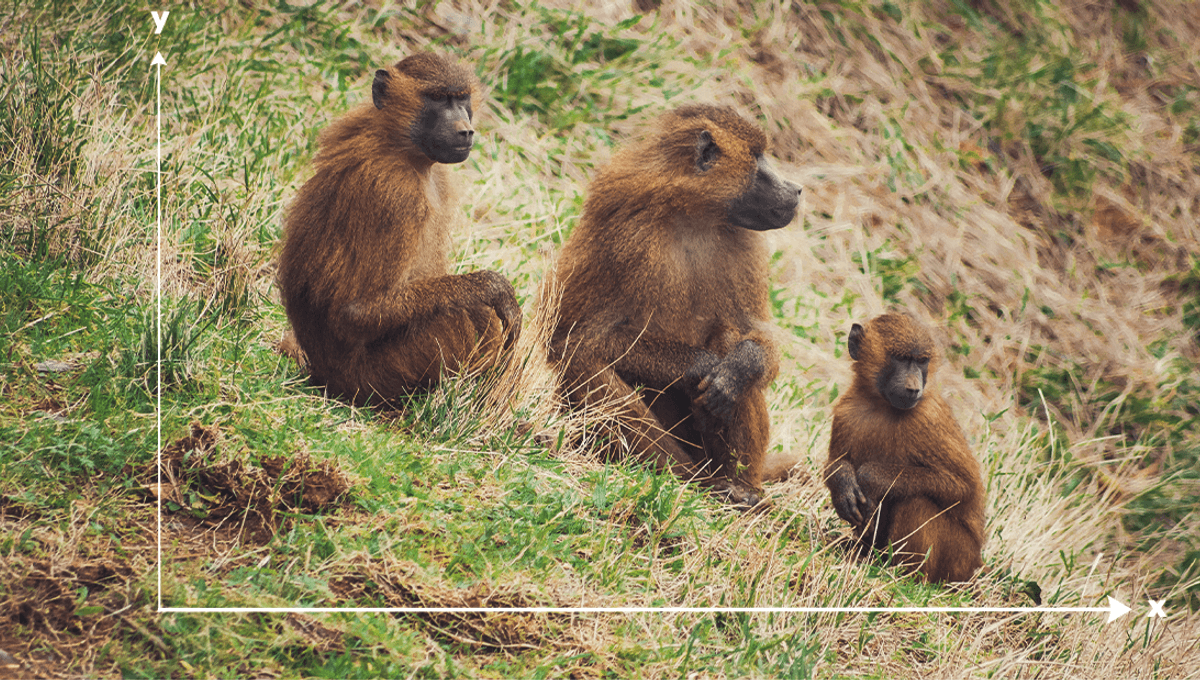
But still, you probably wouldn’t want to hire, say, a monkey to do statistical analysis. Unless, that is, you’ve read a new paper from researchers out of Paris and Marseille, which claims to show that baboons can understand scatterplot graphs and extract information about the statistical trends shown within.
“Humans are known to perform remarkably well at tasks involving statistical evaluations of their environment, an ability with clear evolutionary advantages,” reads the paper, currently available as a preprint – that is, not yet peer reviewed.
“They correctly estimate the probability of the occurrence of events drawn from given distributions; they can recognize and learn statistical regularities in both linguistic and non-linguistic stimuli,” the authors explain; “they can extract the average of many different features such as color, orientation or size from large datasets of items, a set of skills that has been called ‘ensemble perception’.”
And, turns out, we’re not the only smart monkeys out there. “For instance, chimpanzees can make probability judgments based on several proportional ratios,” the authors point out, while “long-tail macaques can infer simple heuristics, capuchin monkeys can make probabilistic inferences, and baboons can learn spatial statistical contingencies.”
But can they do what humans do – perform ensemble evaluations on a given dataset? To find out, the researchers taught a group of 23 Guinea baboons to associate the various qualities of scatterplots – their noise level, whether the trend was increasing or decreasing, that kind of thing – to certain geometric shapes. It was, basically, a way for the monkeys to describe what they were seeing to the researchers – akin to a human test subject saying “ooh, not much of a correlation here, but generally a negative relationship.”
Now, you may not think such a judgement is based on detailed statistical calculations – and it’s not, to be fair – but this kind of intuitive assessment of data actually lines up pretty well with a measure known to statisticians as the t-value. It’s “a summary of several data features,” the researchers explain; “it combines the signed slope (either positive or negative), the level of noise in the dataset (with noisier scatterplots resulting in lower t-values), and the number of points in the graph (the larger the number, the higher the t-value).”
Why is that important? Well, it turns out that not only were the baboons able to perform the same kind of intuitive statistical analysis as human adults and children – albeit less accurately, especially on harder tasks – but they did so using the exact same t-value measure.
“We found that, if the animals were provided with easily distinguishable response stimuli, they could learn this task,” the researchers report. “Their performance, in the presence of noise, was predicted by the t-value of the scatterplot, the index that a statistician would use to compute the strength of the correlation in the plot.”
This isn’t just exciting for fans of baboons and statistics, however. It also has some pretty interesting implications for our understanding of how the brain processes statistical information at all: “this similar behavior, observed in both humans and baboons, suggests that the human visual system, when performing trend judgments over noisy datasets, recycles phylogenetically older brain areas involved in the recognition of the principal axis of objects,” the paper explains.
It’s not a new hypothesis, but the addition of more evidence is tantalizing. The idea, basically, is that humans are taking bits of their brain that once were used for lower-level environmental assessments – think: numerical approximation of visual stimuli – and using them for much higher-level calculations that are close enough to the original for the brain to be able to wing it – think: symbolic mathematics. It’s bolstered by the suggestion that the baboons’ weaknesses in more complex tasks may have been due to a lack of cultural context – that is, they couldn’t “see” the data the same way human participants could, but it might have just been that they hadn’t been taught to, rather than the species difference.
In any case, there was definitely one way in which the baboons mirror their human cousins in mathematical ability: some of them just don’t have it.
“As in humans, sensitivity in the trend judgment task varies among individuals,” the researchers report. “This finding should push animal cognition researchers to always consider inter-individual variability when studying the performance of non-human animals.”
The study, which is yet to be peer-reviews, can be found on the biorXiv preprint server.
Source Link: Baboons Appear To Do Statistics The Same Way You Do