There are, Mark Twain was famously fond of declaring, three types of lies: lies, damned lies, and statistics. It’s a succinct summation of something we’re all kind of aware of in our bones, even if we don’t know the precise explanation for it: that statistics can’t entirely be trusted – they’re simply too easy to manipulate for nefarious purposes.
ADVERTISEMENT
Chief example: Simpson’s paradox. Beloved by bad statisticians who don’t realize it, and very good ones who definitely do, this phenomenon is powerful enough to completely reverse correlations in the data – and all technically without telling a single lie.
So, what is it?
What is Simpson’s Paradox?
Imagine you’re a doctor deciding whether or not to prescribe a certain treatment for a patient. You have the following information:

A table of success and failure of a treatment vs. control showing population-wide, male, and female data.
Image credit: IFLScience, adapted from Stanford Encyclopedia
What’s the obvious course of action? For both male and female subjects, the treatment performed better than the control protocol, and your patient is most likely one of those two options – but combine the two groups, and it seems to be ineffective. How can both these things be true?
“Simpsons Paradox is a statistical phenomenon that occurs when you combine subgroups into one group,” statistician Jim Frost explained in a post for his website Statistics by Jim. “The process of aggregating data can cause the apparent direction and strength of the relationship between two variables to change.”
The “paradox” was first noticed back in 1899, but it wasn’t until the 1970s that it got its Groeningesque moniker, when mathematician Colin Blyth named it in honor of the codebreaker and statistician Edward Simpson, who had presented a detailed analysis of the effect in a now-famous 1951 paper.
ADVERTISEMENT
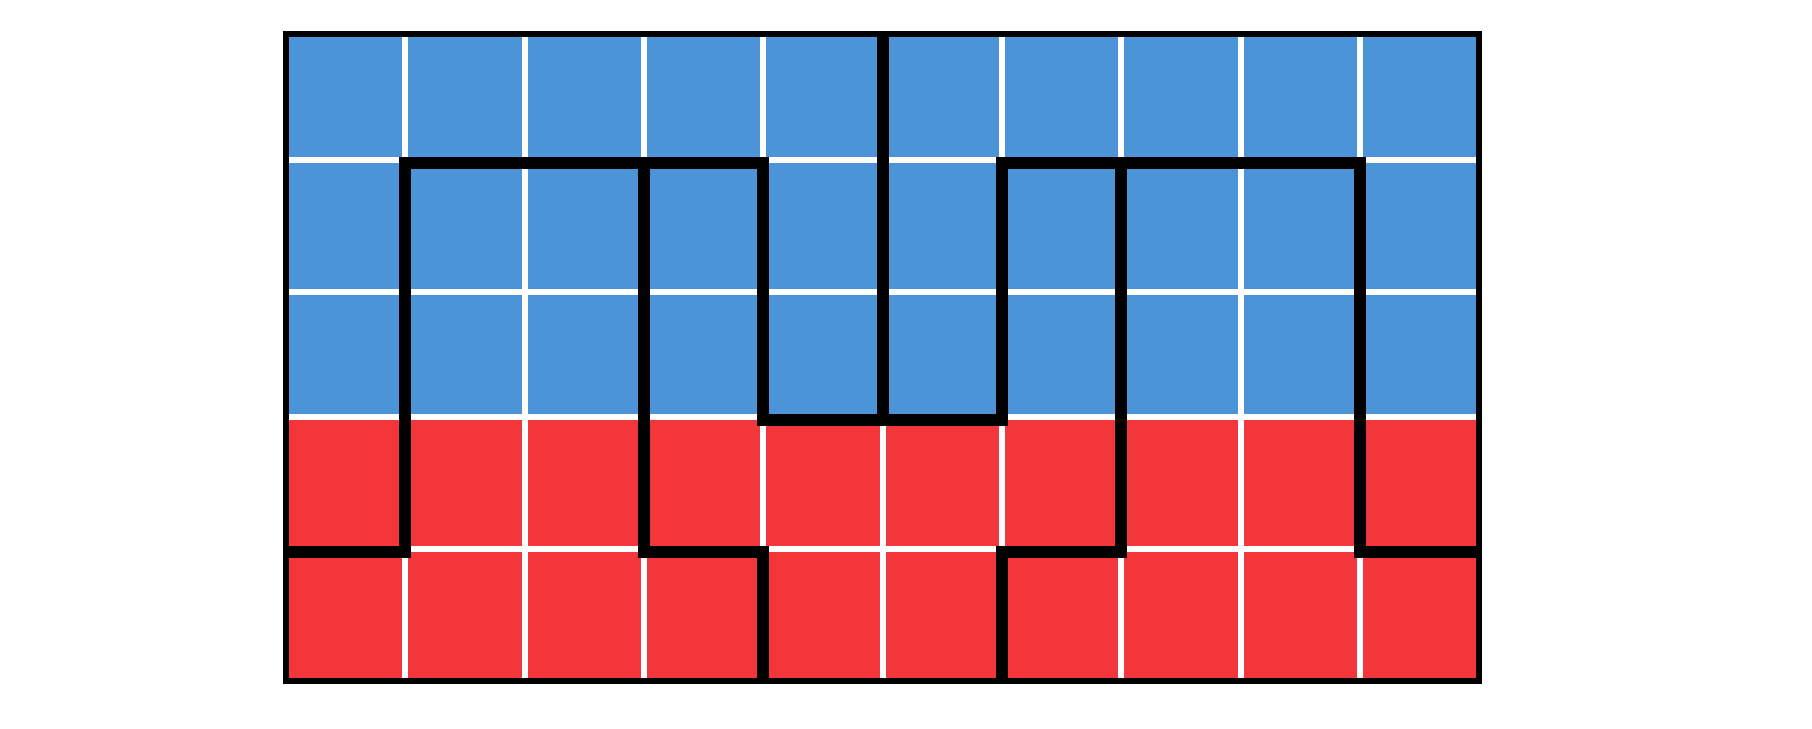
These days, understanding the phenomenon is more important than ever, as it’s utilized by bad actors who want to spread misinformation about COVID-19 or vaccines, or promote unscientific and bigoted opinions. It can even be used to rig elections via gerrymandering: consider the voting pattern in the region below, where each square represents one precinct.

Feels like an obvious win for blue, right?
Image credit: IFLScience
Evidently, there are more votes for the blue party than the reds – so, given five representatives, common sense suggests three should be blue and two red. But here’s a question: what if we split the precincts up like this?

Haha, thought you lived in a democracy, did you??? Fool.
Image credit: IFLScience
There are still five districts, equally distributed by population. Now, though, red has won three precincts to blue’s two – literally reversing the overall result.
Clearly, Simpson’s paradox is powerful – and far more than just a niche statistical technicality. So, what’s behind it?
Why does Simpson’s paradox occur?
Life is rarely simple, and statistics even more so. Choose to ignore that, and Simpson’s paradox is where you end up. “[It] occurs when the process of aggregating data excludes confounding variables,” Frost explained – in other words, when you assume all data is equal, without taking into account the impact of certain other properties on your sample.
“Usually, this happens unintentionally,” Frost added. “It is shocking how easily it can happen if you don’t watch for it!”
Indeed, it’s easy to do, not least because – almost by definition – a confounding variable is something you’re not looking for. Say you’re investigating how effective a certain intervention is at preventing deaths from a particular virus: you’re going to immediately measure how many people receiving the intervention died from the disease versus how many didn’t, and the same for some control group not receiving it. That totally makes sense – and so you might not think to stratify the data by age, or lifestyle, or medical history, even though doing so could totally change the results.
Don’t believe us? No need to take our word for it: that exact situation actually occurred back in 2022, when social media memes took off claiming that getting vaccinated against COVID-19 was ineffective or even dangerous.
ADVERTISEMENT
Obviously, it was far from the first time people had told this lie, but this time they had what appeared to be hard data backing up the assertion: in April of that year, analyses had shown that about 6 in 10 adults dying of COVID-19 were actually vaccinated or boosted, a statistic that held strong throughout the year. Could it be true? Did being vaccinated make you 50 percent more likely to become a victim of COVID-19?
Well, no. “The relationship between being vaccinated and having a higher percentage of deaths is a fiction created by aggregating data and tossing out relevant information – Simpson’s Paradox,” Frost confirmed.
“In the United States, the COVID vaccinated population tends to be older and has more risk factors,” he explained. “This group naturally tends to have worse COVID outcomes. However, when you adjust for age and other risk factors, the CDC finds that COVID vaccinated and boosted individuals have an 18.6 times lower risk of dying from COVID. The vaccines are working!”
Avoiding Simpson’s paradox
Clearly, then, Simpson’s paradox is something we need to be aware of – both to avoid it in our own analyses, and to be canny when other try to use it on us. Here’s the problem, though: it’s kind of hard to watch out for.
ADVERTISEMENT
“The extent to which Simpson’s paradox is likely to occur in experimental research is difficult to determine because what has not been tested and reported in a publication cannot be detected easily by a reader,” points out one 2009 paper on the phenomenon.
“One way to investigate this matter is to examine findings across studies,” it suggests. “If there is inconsistency in the relationship between an outcome and treatment across studies, then it may be that confounding has occurred in at least some of those studies.”
Of course, a better solution is for the issue not to arise at all – but that’s down to the statisticians themselves. “Simpson’s Paradox is a powerful reminder of the complexities inherent in data analysis,” Frost cautioned. “[It] teaches us the importance of vigilance and precision in statistical analysis, urging researchers to delve deeper into the data rather than accepting surface-level insights.”
Data aggregators should be careful to “always question the data; look beyond the aggregates; [and] strive for clarity and accuracy in every dataset you encounter,” Frost advised. “By doing this, you can ensure that your study results accurately reflect the underlying trends and patterns in the data.”
Source Link: Simpson's Paradox: The Statistical Phenomenon That Can Turn Real Results Backward