


Researchers from the University of Copenhagen have found decades-old aerial photos that are helping them better understand the collapse of Antarctic ice shelves. The photos offer an unparalleled dataset that could also improve our ability to predict sea level rise and influence how we approach climate action.
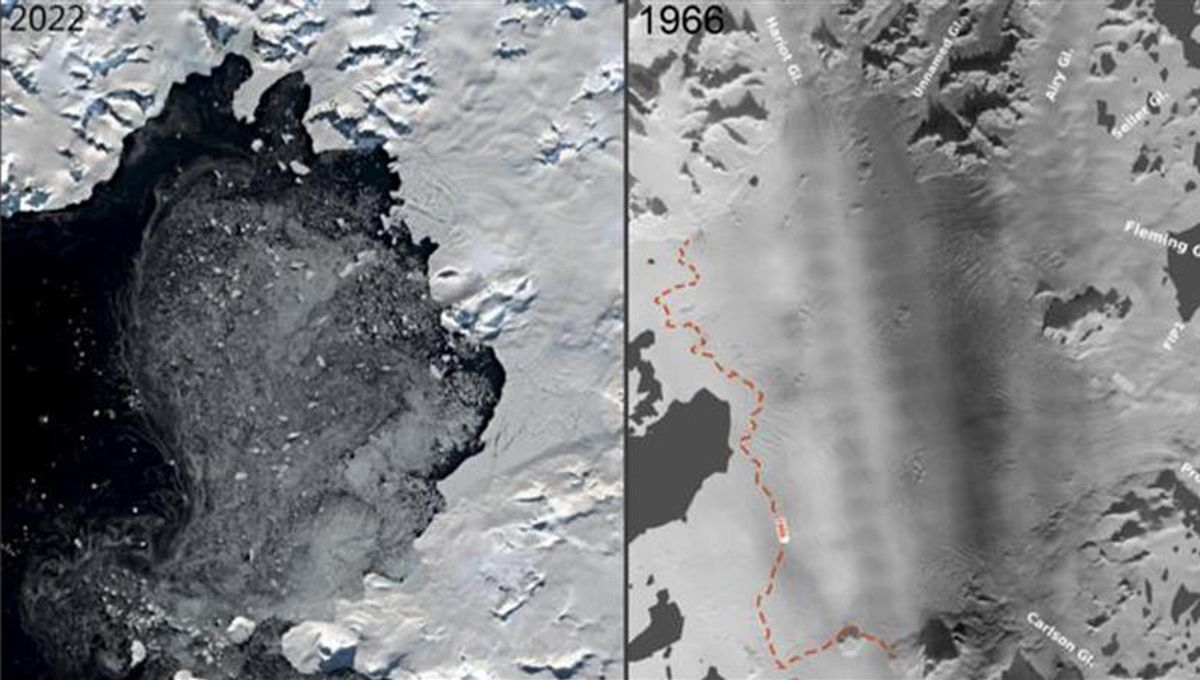
On November 28, 1966, an American flight crossed the Antarctic Peninsula south of the southernmost tip of Chile. The plane was there to map the Antarctic landscape. Using a camera that may have been borrowed from the US Navy, the plan captured shots of the Wordie Ice Shelf, a once prominent part of the western Antarctic Peninsula located in Marguerite Bay. Once upon a time, this ice shelf – made up of multiple glaciers – covered an area of around 2,200 square kilometers (849 square miles), but as of the late 1980s, it started to retreat. By the early 2000s, it was almost completely gone, leaving behind a few small individual shelves.
An outcome of this loss was that the “plug” that held a lot of glacier ice broke off, contributing to sea level rise. Thankfully, the Wordie Ice Shelf was comparatively small, so this has only amounted to a rise on the scale of millimeters. However, there are more ice shelves in the Antarctic that could collapse due to climate change. Two in particular – Ronne and Ross – are thought to hold enough ice to produce a sea level rise of up to 5 meters (16 feet).
This will not be a remote incident either. It may feel like it is a long way away, but if these two ice shelves melt, then the sea level rise will be felt in places in the Northern Hemisphere too. This is where the newly discovered photo of the Wordie Ice Shelf can be so useful, representing a valuable first data point in the study of the ice shelf’s collapse over the subsequent years.
The team behind the research has used the image, alongside a vast archive of old aerial images and modern satellite observations, to show the collapse of an ice shelf as a constant process over a long period of time. This offers important insight that can help improve our understanding of these large icy structures and the mechanisms behind their demise. Moreover, it can be used to inform computer models to predict sea level rise, so we can prioritize how to adapt to climate change.
“We have identified several signs of incipient ice shelf collapse that we expect will be observed in other ice shelves, but perhaps more importantly, the dataset has given us a multitude of pinning points that can reveal how far advanced a collapse is,” lead author Mads Dømgaard, a postdoc from the Department of Geosciences and Natural Resource Management at the University of Copenhagen, said in a statement.
“It’s a completely new tool that we can use to do reality checks on ice shelves that are at risk of collapsing or already in the process of collapsing.”
The historical aerial photos were analyzed with a technique known as “structure-from-motion” photogrammetry, which allows scientists to reconstruct the ice’s thickness, its surface structure, extent, and its flow velocity all the way back to the 1960s.
What did this tell them? It was always assumed that the Wordie Ice Shelf collapsed due to a warmer atmosphere. At the same time, scientists believed that meltwater lakes had formed on the ice’s surface, which contributed to its disintegration. But analyzing the photos reveals that that does not seem to have been the case. Instead, the new research suggests that the main melting occurred under the ice where the sea and the shelf met.
“Our findings show that the primary driver of Wordie’s collapse is rising sea temperatures, which have generated the melting beneath the floating ice shelf,” Dømgaard said.
This research has already had a significant impact on our understanding of ice shelf collapse.
“The tentative conclusion from our findings is that ice shelf collapse may be slower than we thought. This means that the risk of a very rapid development of violent sea level rise from melting in Antarctica is slightly lower, based on knowledge from studies like this one,” study author Anders Anker Bjørk, Assistant Professor at the Department of Geosciences and Natural Resource Management, added.
But there is another side to this.
“It was already a supertanker that needed to be turned to stall the melting of ice in Antarctica, but our data shows a collapse process that is even more protracted than previously assumed,” said Bjørk. “And this longer process will make it harder to reverse the trend once it has started. This is an unambiguous signal to prioritize halting greenhouse gas emissions now rather than sometime in the future.”
The study is published in Nature Communications.


Source Link: "Unambiguous Signal" To Curb Emissions Now: Long-Lost Aerial Photos Reveal Evolution Of Antarctic Ice Shelf Collapse