Cohort analysis is a way of evaluating your business that involves grouping customers into “cohorts” and observing how they behave over time. A commonly used approach is monthly cohort analysis, where customers are grouped by the month they signed up, allowing you to observe how someone who joined in November compares to someone who signed up the month before.
Cohort analysis gives you a multivariable, forward-looking view of your business compared to more simple and static values like averages or totals.
Cohort analysis is flexible and can be used to analyze a variety of performance metrics including revenue, acquisition costs and churn.
Let’s imagine you’re the CMO of the “Bluetooth Coffee Company.” You sell a tech-enabled “coffee composer” that brews coffee, tracks consumption and orders replacement coffee when users are running low. The longer your customers are subscribers, the more money you make. You recently ran a Black Friday feature on a popular deals site and you’re interested to know if you should run it again.
The chart below is a simple analysis you might do to gauge your marketing performance. It shows the total customers added each month, and a clear spike in November following the Black Friday promotion. At first glance, things look good — you brought in more than double the monthly customers in November compared to October.
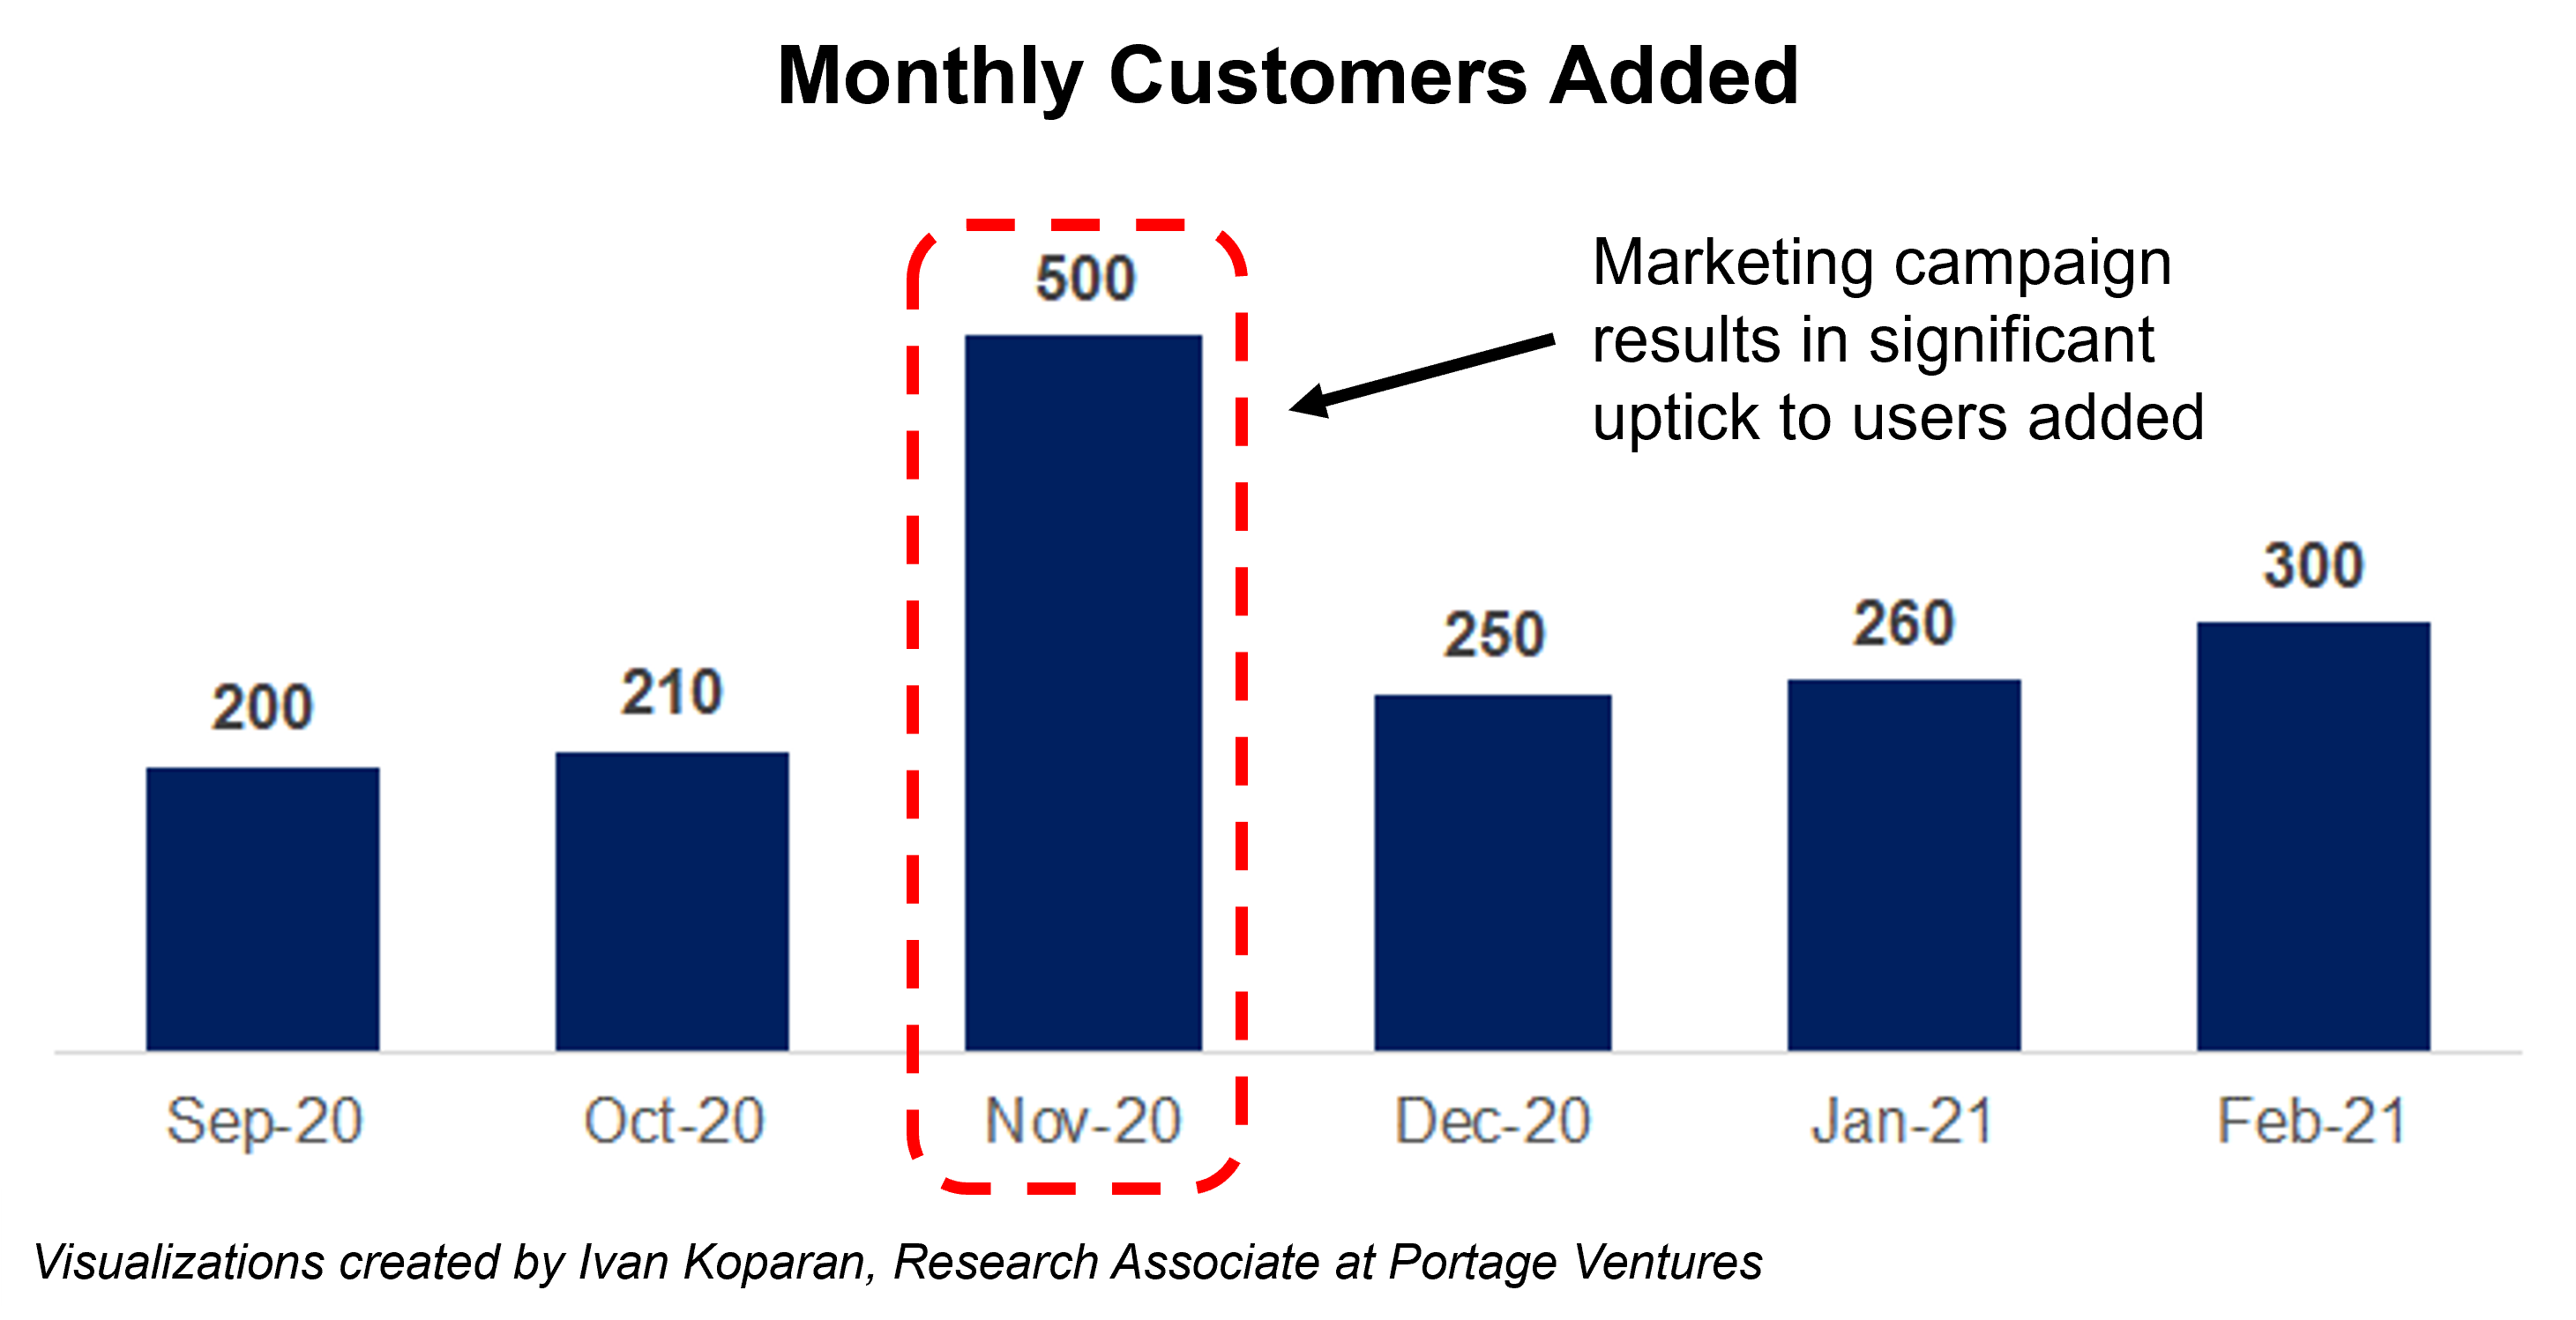
Image Credits: Sagard & Portage Ventures
But before you rebook the promotion, you should ask if these new Black Friday consumers are as valuable as they seem. Comparing monthly customer percentage is a good way to find out.
Below is a monthly cohort analysis of new customers between September 2020 and February 2021. Like our previous chart, we’ve listed the monthly cohort size, but we’ve also included the customer engagement rate (calculated by dividing daily active users by monthly active users or DAU/MAU for each month (M1 is month 1, M2 is month 2, and so on).
This analysis lets us see how the customer engagement of each monthly cohort compares to the next.
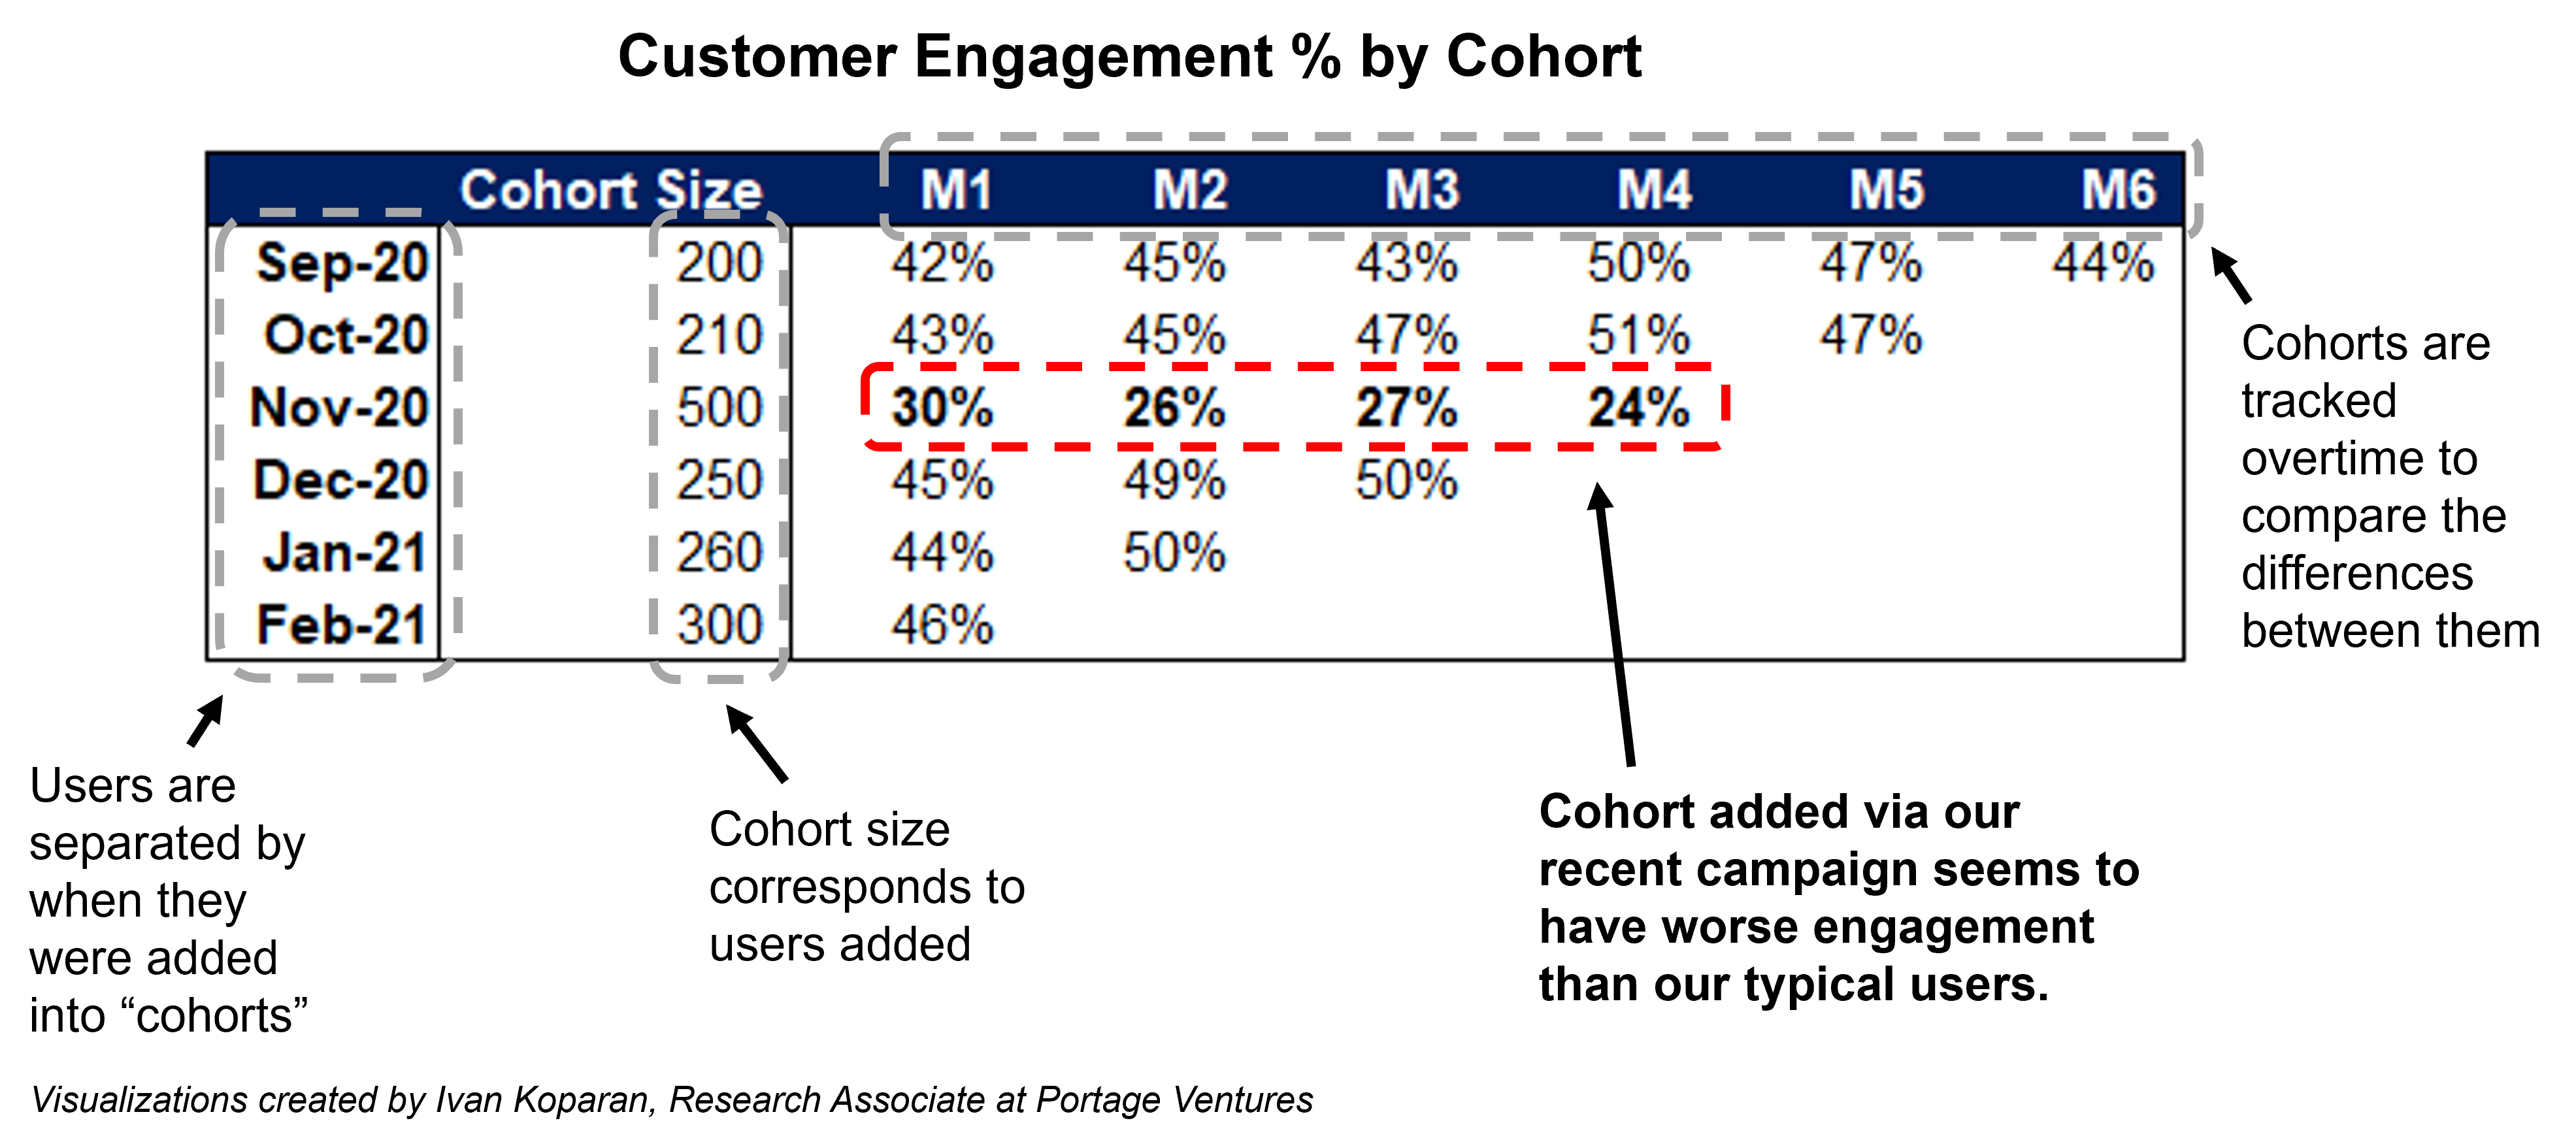
Image Credits: Sagard & Portage Ventures
From the figures above, we see that most cohorts have a customer engagement rate in their first month (M1, 42%-46%), meaning 42%-46% of new customers use the coffee composer everyday. The November cohort however has materially lower engagement (M1, 30%), and remains lower in subsequent months (M2, 26%) and (M3, 27%). Interestingly, the customer engagement rate only drops with the November cohort, returning to normal with the December cohort (M1, 45%).
Source Link Use cohort analysis to drive smarter startup growth
Leave a Reply